 |
Final
Project
Al
Bierschbach
CET
765
Leadership
in Technological Change
Dakota State University
1. Statement
of Technology Goal/Objective:
Goal #4: Community Involvement: Increase links between parents, community, business and the school district to encourage and understand partnerships.
- Utilize the Internet to increase communication between the school and home, and increase public participation in district programs.
2. Identify the Professional Faculty/Staff with Whom You Helped to Solve the Problem:
The high school technology committee members:
Rebecca Stapert – building principal
Kristi Olson – computer and business teacher
Al Bierschbach – math teacher
Mike Lynch – English teacher
Cheryl Heilman – Cisco and Aires teacher
Todd Buetler – technology administrator
3. Flowchart of How the Problem was Solved.

4. Appropriate Use of at Least One of Each Type of TQM Problem-Solving Tools:
In the summer of 2001, the Madison Central school board mandated that each school implement a phase of goal #4 of the Madison Central technology plan by the end of the school year. A phase must be implemented for each of the next three school years. All of the members of the high school technology committee met on September 13, 2001, to decide how the goal was going to be implemented for this year’s phase. Ideas needed to be generated and organized on how to implement the goal. Al Bierschbach was chosen to lead the discussion, as he just completed Leadership in Technological Change. The problem was well established: How do we implement the goal to increase links between parents, community, business and the school district to encourage and understand partnerships, and utilize the Internet to increase communication between the school and home, and increase public participation in district programs.
Al decided to use the Crawford Slip Brainstorming method to allow the members to freely input their suggestions on how to meet the goal for this year. He gave each member of the group a pad of wide Post-It notes and told them that they could not talk during the brainstorming activity. He told them to write no more than six words on a note to suggest what they thought the staff should do to meet the goal. He instructed them to put their slips in the middle of the table once they were finished with each one, which would foster more ideas. This activity went on for a few minutes until there were no more slips being written.
Then Al led the group in making an Affinity Diagram using the slips created in the brainstorming activity. He told the group to arrange the Post-It notes into columns of similar ideas. Again, he instructed the group not to talk during this activity. The group put the slips into two columns, one involving parent communication and one involving businesses. Members of the group looked very hesitant to have eight slips in one column, so Al suggested that a large column could be split up into two columns. Slips were then rearranged into three columns until everyone was satisfied. Then Al had them discuss what an appropriate heading for each column should be. He limited the group to three words to describe each column. The resulting affinity diagram appears below.
|
Basic
Parent Communications |
Advanced
Parent Communication |
Business
Participation |
|
Assignments need to be online |
Use discussion boards |
E-mail links to businesses |
|
E-mail links for parents |
Use online chats for Conferences |
Job shadowing at businesses using Internet |
|
Contact information for parents |
Video-conferencing with parents |
Guest speakers from businesses |
|
Grades accessible to parents |
Automatically e-mail grades to parents |
E-pals with business owners/managers |
|
|
|
Students teaching tech skills to community |
Al then decided to use light voting to decide which category of ideas that the group wanted to use to meet the goal of the school board. Each member voted by prioritizing each column heading from 3 (most important) to 1 (least important). The results of the voting appear below.
|
|
Basic Parent Communications |
Advanced Parent Communications |
Business Participation |
|
Rebecca |
1 |
2 |
3 |
|
Kristi |
3 |
1 |
2 |
|
Al |
3 |
2 |
1 |
|
Mike |
3 |
1 |
2 |
|
Cheryl |
2 |
3 |
1 |
|
Todd |
3 |
2 |
1 |
|
Total |
15 |
11 |
10 |
Al used a pareto chart to show the group the results of the light voting.
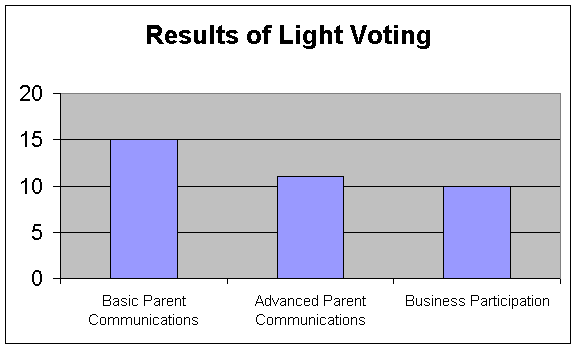
In order to help the group understand the forces that will affect the category that was just chosen, Al used a force field analysis on the whiteboard in the front of the room.
Forces that are exhibited with Basic Parent Communication |
|
|
Driving
Forces |
Restraining Forces |
|
Assignments online helps when student absent |
Teachers don’t keep assignments current Assignments can change depending upon class Some teachers lack expertise to do this |
|
E-mail is effective way to contact teacher |
Teachers don’t check E-mail for days Some teachers lack expertise to do this |
|
Contact information on web allows parents to call when teacher is free |
Teachers need to keep schedule updated Some teachers lack expertise to do this |
|
Grades online allow parents to check progress their children |
Teachers do not update grades very often Teachers don’t like to use grading program Some teachers lack expertise to do this |
As it was getting late and it was time for Al to go to football practice, Al decided to close the meeting for that day, and meet at the next early release period in two weeks on September 27. Al told the group to think about the restraining forces and discuss them with staff members, as at the next meeting they would work on minimizing the restraining forces.
At the next meeting, Al asked for any comments on the restraining forces and how to minimize them. Mrs. Stapert reported that instead requiring teachers to hand in lesson plans every week, she would check teachers’ web pages for updated assignments and updated grades each week. Mr. Lynch had an idea on solving the teacher keeping their schedule updated problem. He suggested that if the teachers were taught how to put on their schedule for the entire year, then they would only have to update the contact information once a year. No one had a good suggestion for the restraining force of teachers not checking their e-mail. Everyone agreed to remind fellow staff members to check their e-mail when they submit their attendance, as they are already sitting at their computer when they submit attendance. Cheryl suggested that she could have her Aries students available to answer the teachers’ technical questions. Mrs. Stapert also suggested that we would need to keep statistics on this process so she has hard data to show to the school board at the end of the school year.
Al then put up on the board a chart labeled “ACTION PLAN”. He told the group that an action plan was a method to show how the goals of the group were going to be attained, who was responsible for them, and when they would be attained by. Then he led the discussion of what, how, who and when.
Action Plan |
|||
|
What |
How |
Who |
When |
|
In-service
time |
Find
time where all staff can get together to get training on creating web
pages. |
Mrs.
Stapert |
Immediately |
|
Assignments
online |
Show
how to use tables or calendars to make an assignment chart that can be
updated weekly. |
Mrs.
Olson |
At
in-service |
|
Grades
online |
Show
how to use WinSchool Grades grading program to html pages to put onto
website. |
Mr.
Bierschbach |
At
in-service |
|
Consistent
first page with contact information and e-mail link |
Show
how to make everyone’s first page consistent for the high school and
show how to include contact information and an e-mail link |
Mr.
Lynch |
At
in-service |
|
Hit
Counters Date
and Time Properties |
Show
how to include hit counters to keep statistics of how many times a site
was visited and how to include date and time properties to show when pages
are updated. |
Mr.
Bierschbach |
At
in-service |
|
Student
assistants |
Train
student assistants in Aries class and have them available to help staff
with problems |
Mrs.
Heilman |
Before
in-service and continue after in-service |
|
Teacher
sites |
Space
allocated on server for each teacher web page |
Mr.
Beutler |
Before
in-service |
|
Follow-up |
Collect
data to see whether goals are being attained by checking updated pages,
checking hit counters, and using a parent survey. |
Mrs.
Stapert |
After
in-service to April 1, 2002 |
The group then took a five-minute break as Mrs. Stapert went to find a date and time for the faculty in-service. When she returned, she had a date of October 8th at the scheduled teacher in-service day. She reported that it would be in the morning. Cheryl asked a question about how the parents would know about putting this information on the web. Mrs. Stapert said that she would put it in the next district newsletter that was published, and put it in a letter to be handed out at parent-teacher conferences. The meeting ended on that note.
The teacher in-service was held with 100% attendance and 100% of the teachers conformed their web pages to meet the plan established by the technology committee. Mrs. Stapert kept statistics each week for 24 weeks on how many teachers kept their assignments up to date and kept their grades up to date. She also kept statistics on the hit counters each week. She gave Al the data on April 2nd and he complied the information into run charts so the group could analyze the data. The charts appear below.
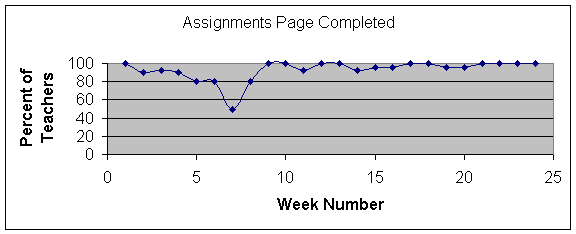
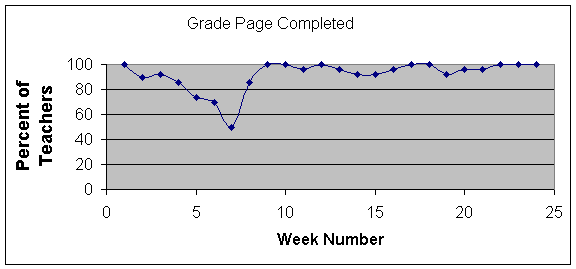
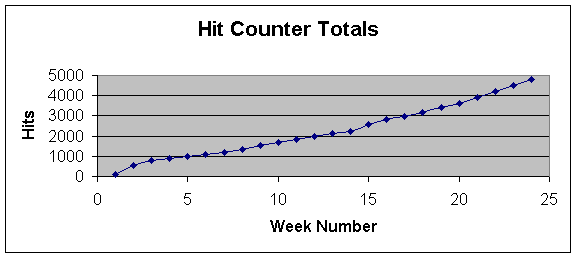
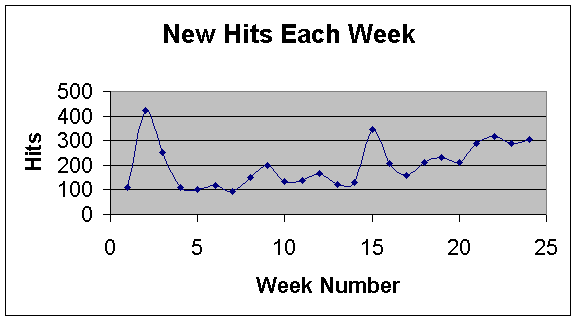
On April 10, the technology committee reconvened to analyze the data and find ways to make any improvements. Mrs. Stapert reported that some of the teachers started getting behind on completing their assignment pages and web pages, but she “convinced” them to make sure they kept up better. It must have worked, as the teachers were near 100% completing after that point. She also reported that the two high points on the new hits each week chart were the weeks of parent-teacher conferences. Other high points in between those points were at the end of the trimester when more parents and students were concerned with their current grades. In the survey that the parents took at the last parent-teacher conference, 90% of the parents knew of the teacher web pages, 81% had visited them, and 46% visited them on a regular basis. Only 5% of the parents said that they used the contact information in contacting a teacher. Then Al lead the group through a plus/delta activity to consider what went well and what could be changed for the future.
|
Plus |
Delta |
|
Contact information not utilized, could inform parents better at start of year. |
|
|
|
Overall, the whole staff bought into the idea of using the Internet of improving the communication process. The school board has mandated to make more improvements for the next school year. More planning and brainstorming will be done this spring to increase communication to either home or the community for the next school year.
5. Your understanding of problem-solving as part of a system:
The
use of TQM tools to solve a problem in a school system utilizes quality tools
that empower everyone involved in the process.
The tools allow people to have a stake in the idea generation,
organization, analyzing, decision-making, and planning process to make the
school a better place for all. Used
appropriately, no one person dominates the process, where the loudest voice
takes charge and gets his or her agenda adopted.
In the process, everyone is equal.
In
the process above, if the TQM process wasn’t used and if the principal would
have mandated all of the changes herself, many things may have happened.
In her mandate, she may not have thought of the same communication tools
that the committee came up with. The
staff may not have bought in to the process as well as they did, as it was
coming from staff members instead of from above. Forces
working against the process may have been too strong to overcome.
In
the Deming view of a system, the above process had an aim, to implement
the school district’s technology goal #4.
The customers were the parents, who needed better ways to
communicate with the faculty. The input was the technology committee, who found ways
to make the process flow more easily. The
supply was the teachers, who needed ways to increase communication with
parents. The process was the
process mentioned above. The output
was the increased communication between the teachers and parents.
The quality measurements were the run charts and the parent
surveys used as a basis for future decisions.
6. Explanations of why you used TQM tools:
I used TQM tools
in this process to give everyone in the committee involved in the process.
I used Crawford slip brainstorming to get ideas flowing from the group to
accomplish the goal in general. Then
I used an affinity diagram to organize the ideas from the brainstorming activity
and to limit our focus onto one area. Then
I used light voting to have the group decide which would be the best area to
focus on and then a pareto chart to show the group the results of the light
voting. Then I used a force field
analysis to get the committee thinking, in the time between our first two
meetings, about forces that would drive and restrain our decision to go with the
chosen. I then chose to use an
action plan so everyone in the group could take part in the process in some way
and so everyone one the committee knew who was responsible for what. After the process was completed, I developed run charts to
show the committee what had happened during the 24-week process, and use that
data to help make decisions for the next segment of next year of goal
implementation. I also used a
plus/delta to consider what went well in process and what could be changed for
the next segment of the next year of goal implementation.
7. Examples of Data Collected on which decisions were made:
The data appears
in the form of run charts.